Monitoring
In the link below there's a Google Drive folder with various resources about monitoring, including a video recording of a walktrough of this documentation.
!ref TWPro monitoring resources
!!!danger If you spot something suspect, check the Troubleshooting section and ask for help when needed! !!!
!!!warning When to monitor Short answer is always.
- Always check Slack channels.
- Periodically during the day, a check over Sidekiq metrics is mandatory to check failed jobs and ensuring queues are stable.
During and after deploy: constantly monitor Sematext dashboards, Sidekiq metrics and Slack channels. !!!
Tools
!!!info General rules
- high spikes are generally bad: response time spikes, RPM spikes, job time spikes, they all need to get your attention
- higher response time impacts RPM: if a web server (or job worker) slows down, it also means that less request can be processed in the same amount of time
- remember the "stagionality": our system load highly depends on venues' opening hours and days, as well as cron schedules !!!
Here you can find a list of useful monitoring tools:
Sematext dashboards
These are Grafana dashboard hosted in Sematext and build over Sematext logs. When using them, please carefully check the time range selected and the refresh interval.
==- If links below are broken see this section
- access Sematext logs page
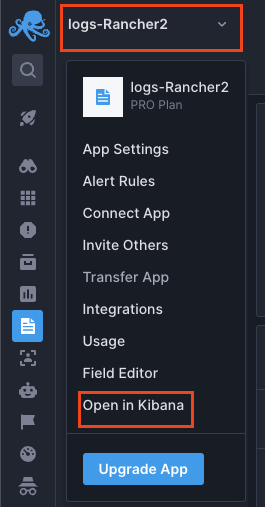
- click on the app name (logs-Rancher2) on the top left corner, then "Open in Kibana"
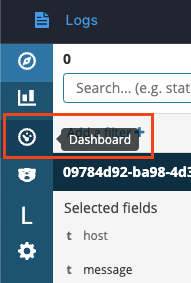
- choose "Dashboard"
- select "Infra Dashboard" ===
Infra Dashboard
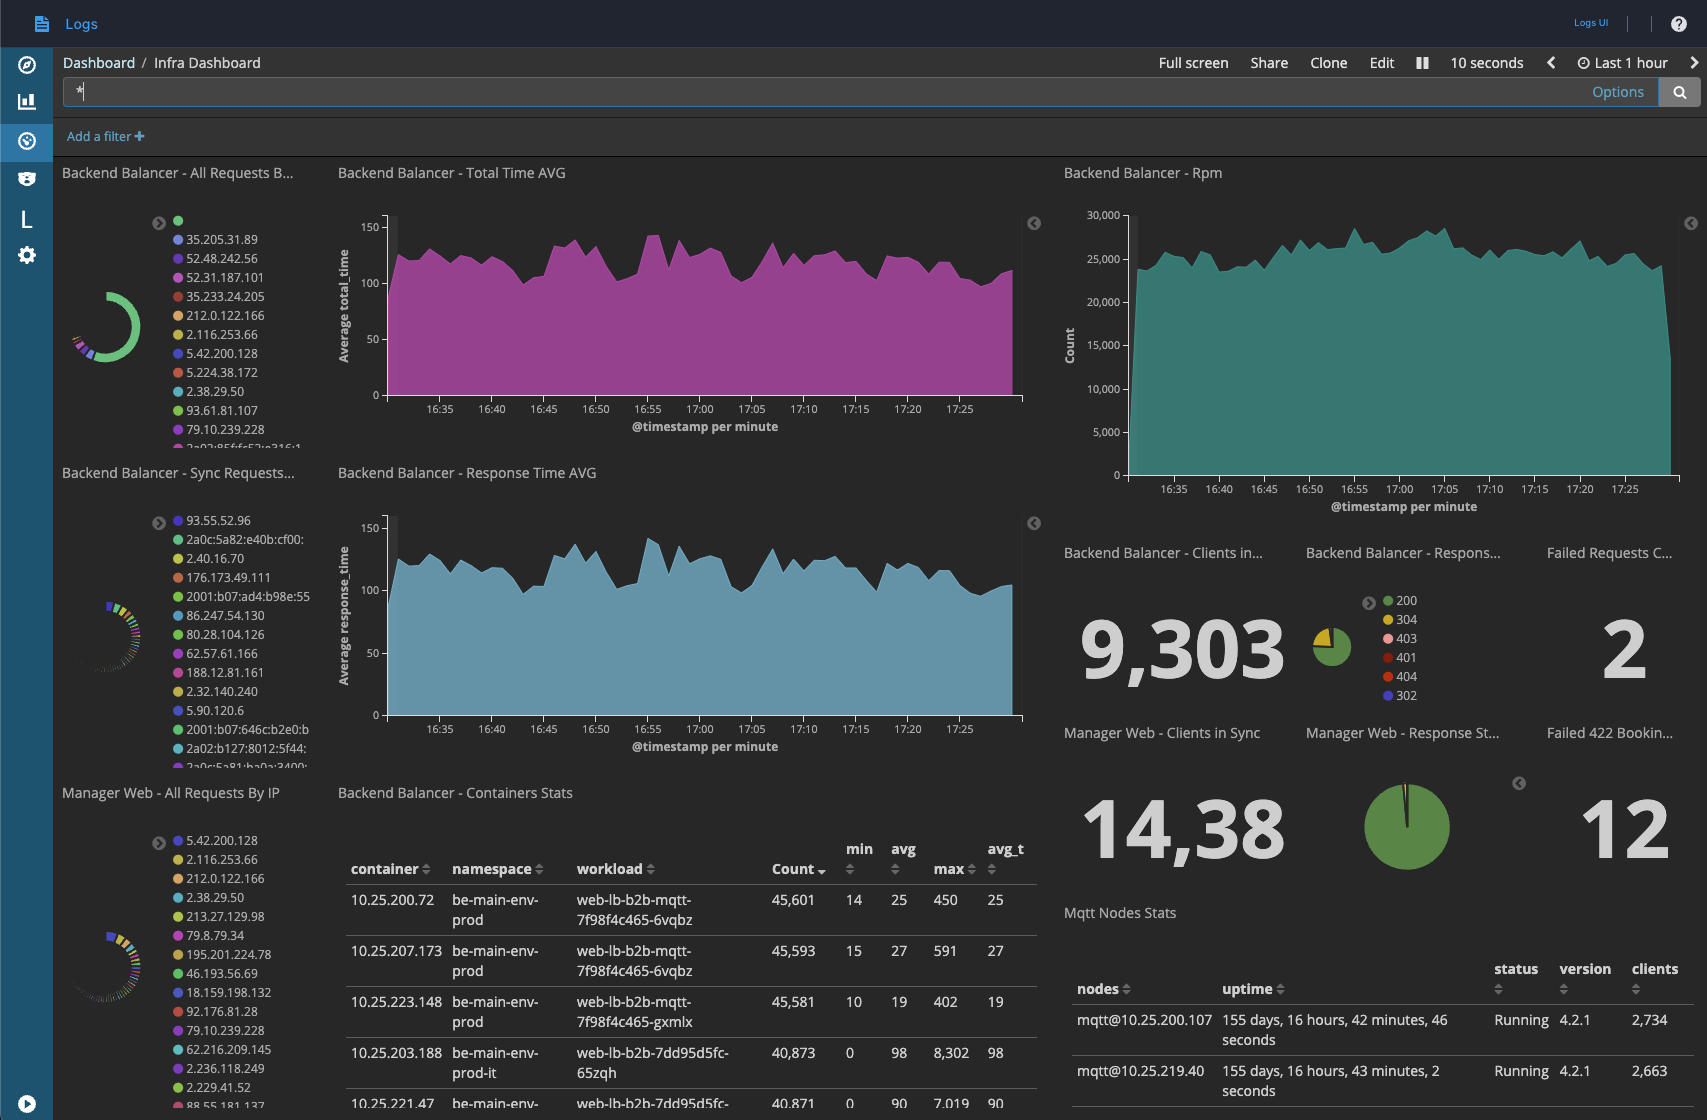
This is the most complete one, it includes many information and details (the definition of these charts can be found in Visualize tab):
- Backend Balancer - All Requests By IP: pie chart and list of request originator by IP extracted from backend haproxy load balancer logs
- Backend Balancer - Total Time AVG: time series chart with AVG total_time extracted from backend haproxy load balancer logs
- Backend Balancer - Rpm: time series chart with number of requests per minute extracted from backend haproxy load balancer logs
- Backend Balancer - Sync Requests By IP:
synch.jsonrequests pie chart and list of request originator by IP extracted from backend haproxy load balancer logs - Backend Balancer - Response Time AVG: time series chart with AVG response_time extracted from backend haproxy load balancer logs
- Backend Balancer - Clients in Sync: number of unique IPs
synch.jsonrequests extracted from backend haproxy load balancer logs - Backend Balancer - Response Status: pie cart of HTTP response statuses extracted from backend haproxy load balancer logs
- Failed Requests Count in Backend Balancer: number of 5xx HTTP response statuses extracted from backend haproxy load balancer logs
- Manager Web - Clients in Sync: number of unique IPs
version.jsonrequests extracted from SaaS client application logs - Manager Web - Response Status: pie cart of HTTP response statuses extracted from SaaS client application logs
- Failed 422 Booking Requests Count: number of 422 HTTP response statuses in v2/v3 bookings extracted from backend haproxy load balancer logs
- Manager Web - All Requests By IP: pie chart and list of request originator by IP extracted from SaaS client application logs
- Backend Balancer - Containers Stats: list of all backend containers with requests' statistics extracted from backend haproxy load balancer logs
- Mqtt Nodes Stats: list of all MQTT nodes' statistics
Things to check
- Total Time AVG should stay stable; may show a peek during release process, but it shouldn't go above 300;
- Total Time AVG and Response Time AVG should show similar graphs;
- Containers Stats for web-lb-b2b-* should be below 180 avg;
- Failed Request count must be always low (under 50 usually) (check Sematext upstream alert if you see issues here);
- Response status should not present 500 errors (or very few);
- MQTT nodes should be always 3 with mostly the same number of clients;
- All Requests By IP should show 3 main IP addresses, while the other should have a low count;
===
Single application monitoring
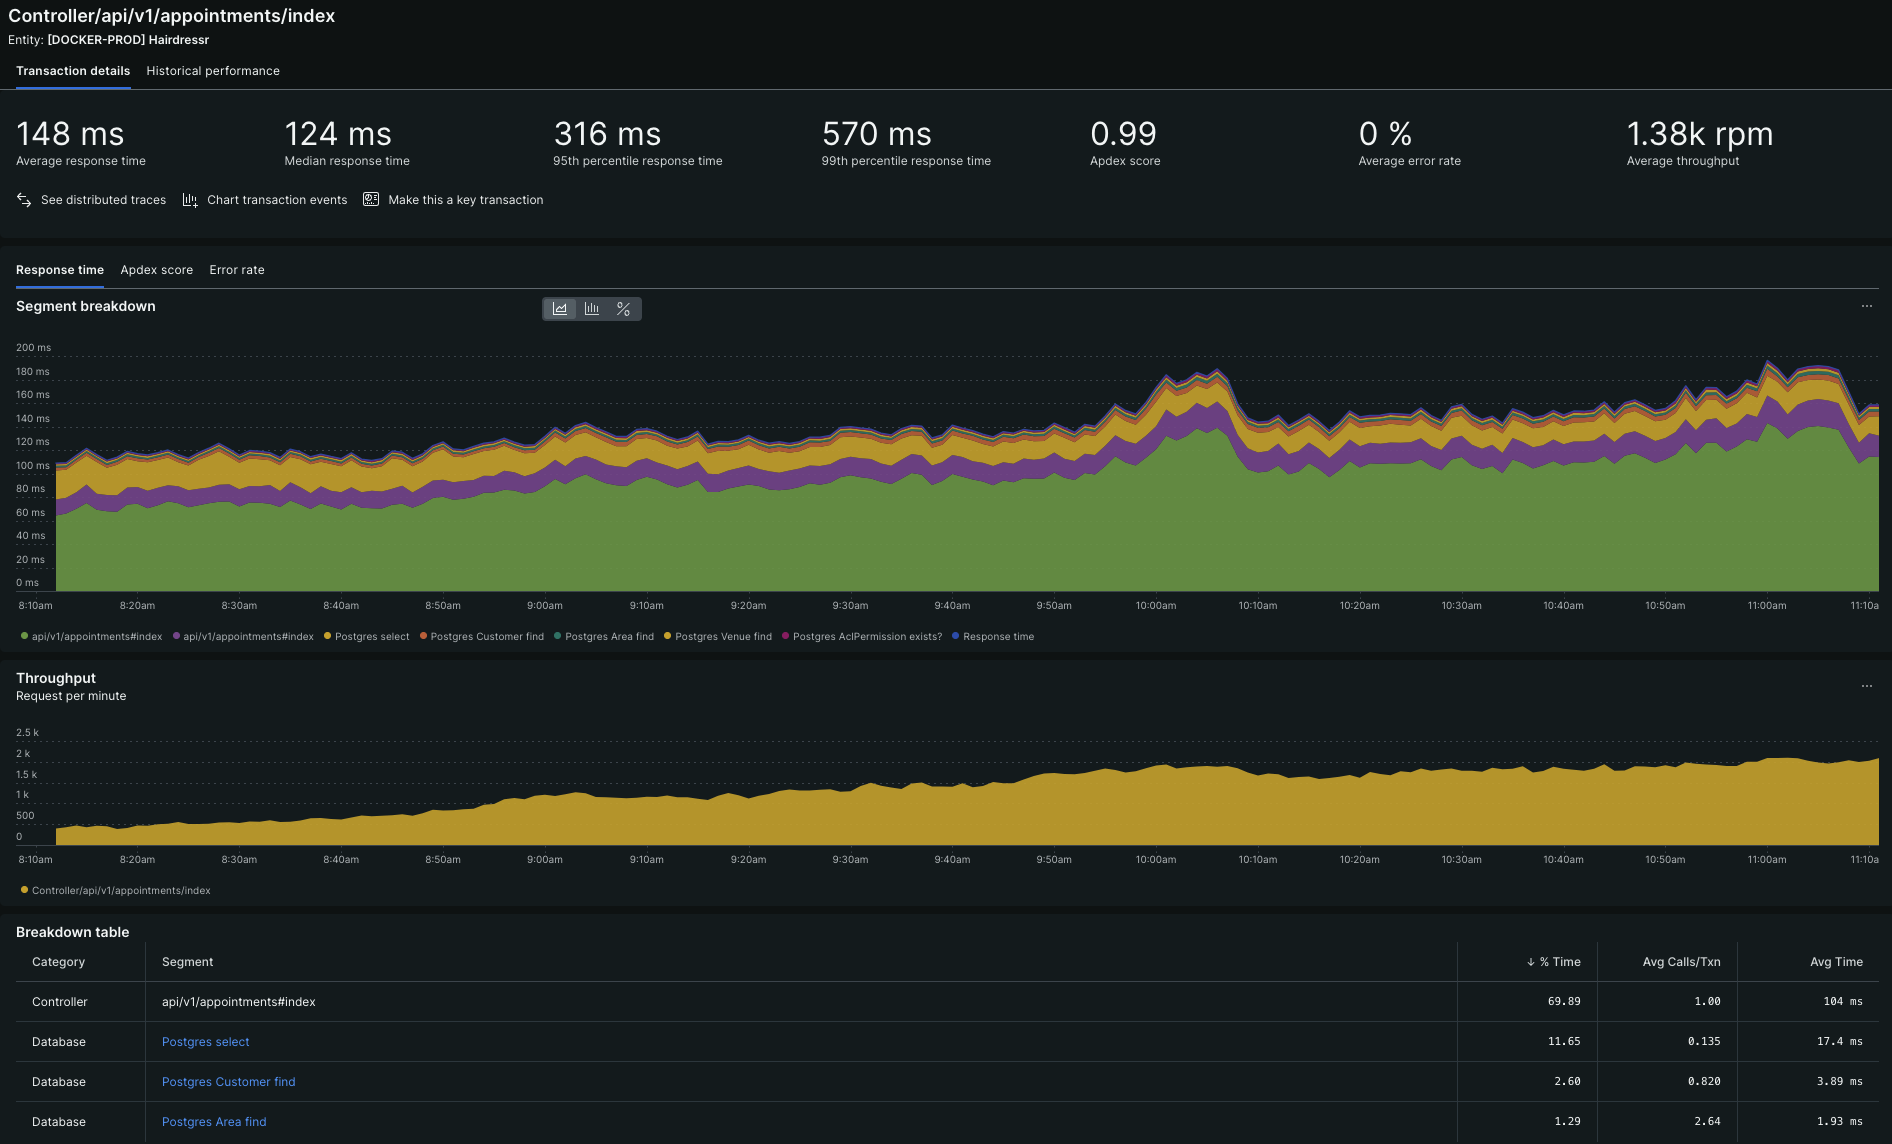
Going into the application page, a lot of useful information can be found.
The summary can be filtered by "Web" and "Non-web" (web and asynchronous jobs), with overall traces breakdown.
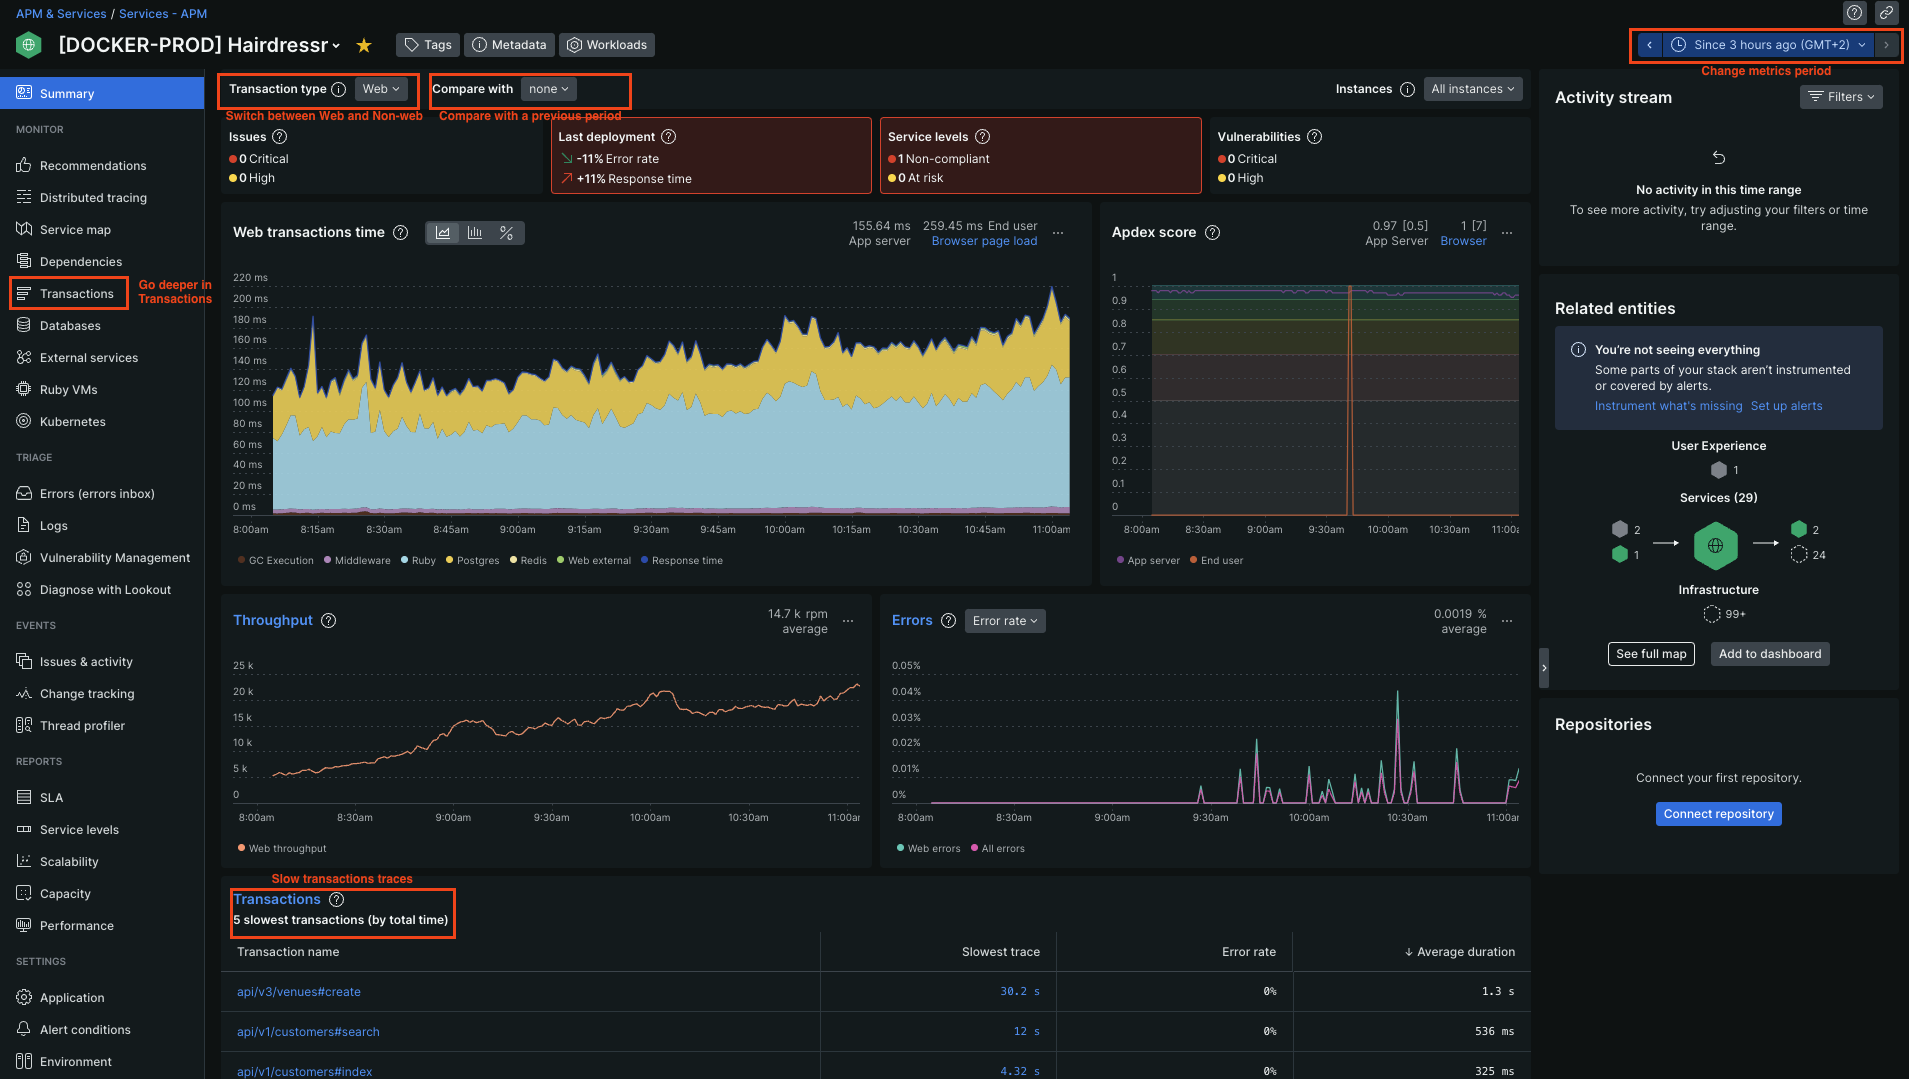
When choosing a single transaction, a timing breakdown is shown:
Sidekiq metrics
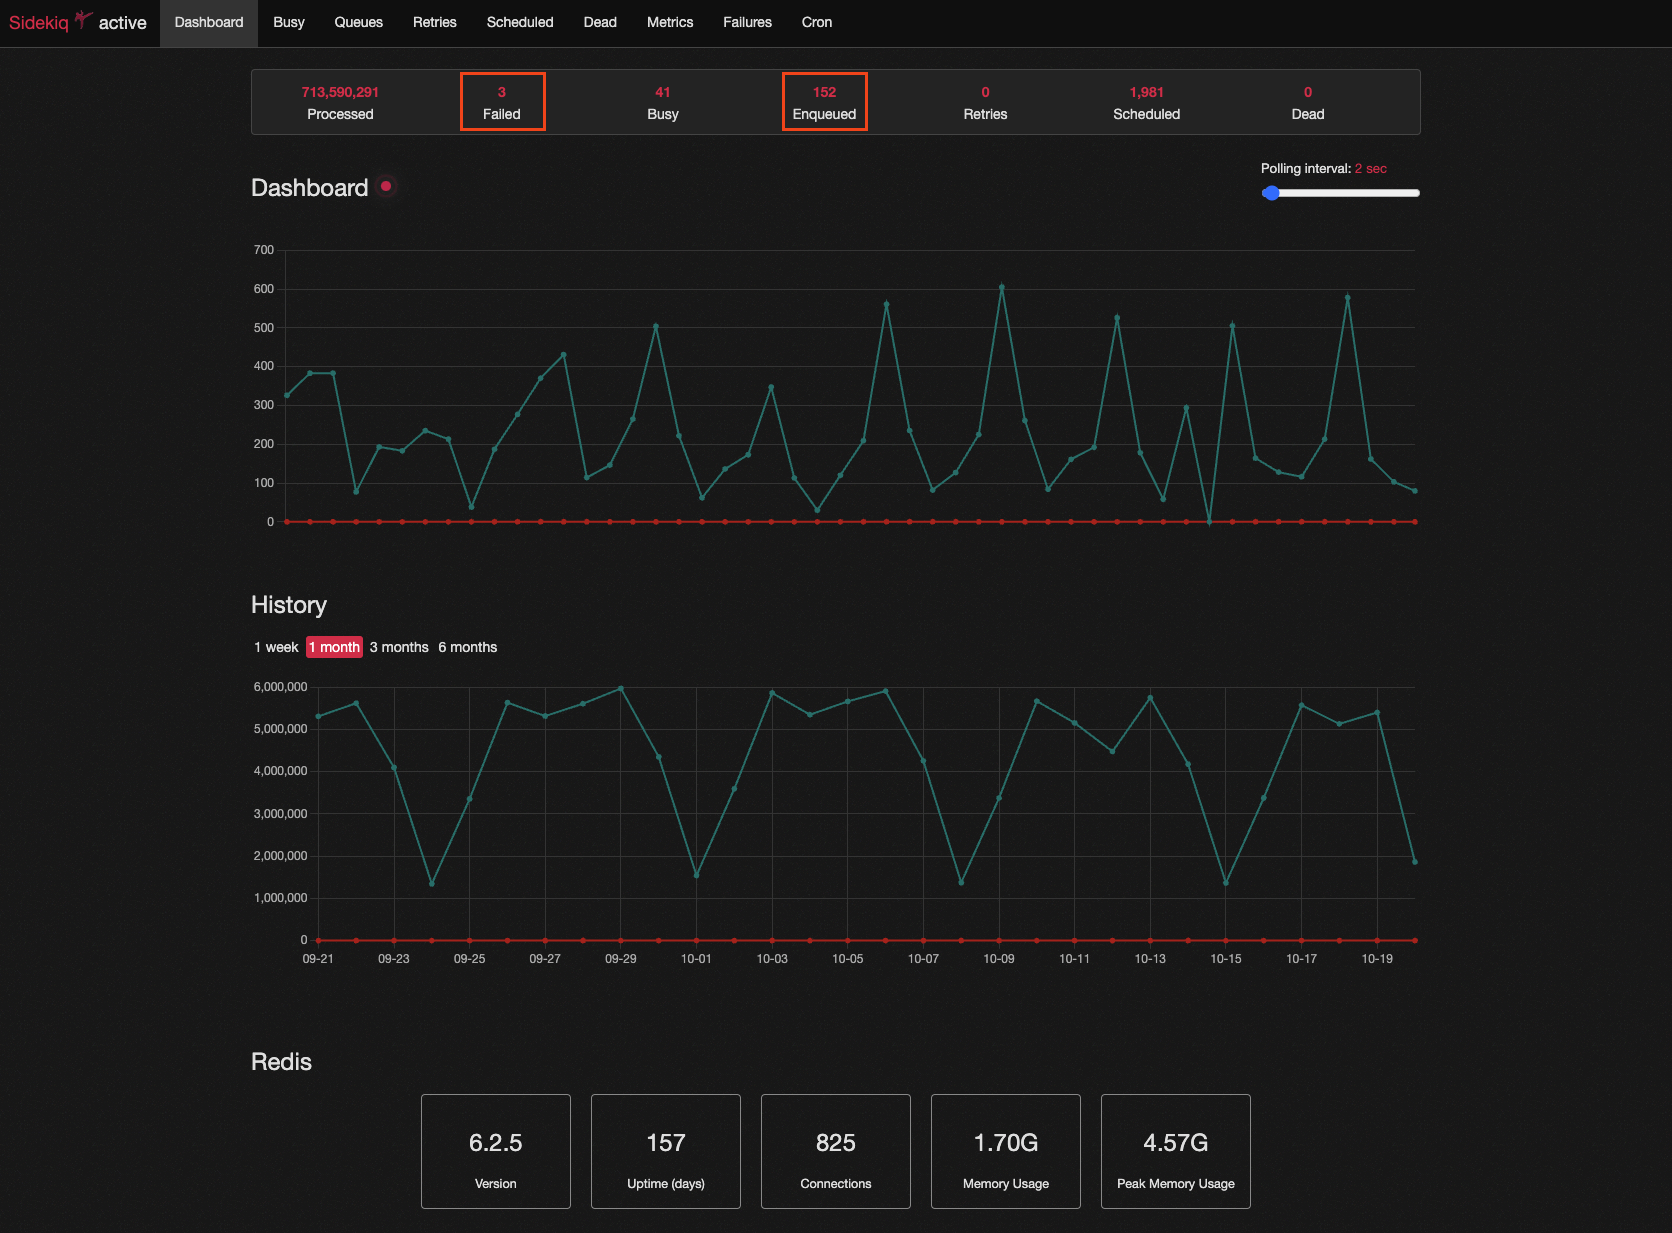
If the expected thing can't be found in these logs, Sidekiq dashboards can show failed jobs and they're good at finding the cause.
!!!warning Check failed jobs It's very important to check each failed job since automatic retrying is not in place for all jobs. !!!
==- Production applications !ref tw-integration !ref uala-brands !ref uala-main !ref uala-statistics !ref uala-internal-tools
Datadog
!ref Datadog Error Tracking !ref Datadog Logs
If there are unhandled errors, they can be found on Datadog:
- full text search is available, so choose some unique identifier of the request (e.g.: the order ID, a service ID, a particular word, etc.)
- use the filter
service:for the workload (web,jobs-worker-*, …) and/orkube_namespace:for the app (be-main-env-prod,be-admin-env-prod,be-tw-integration-env-prod, …) - specify the correct
env: - limit time range
More detail on triage and Uala::Reporter usage: Datadog issues.
Grafana dashboards
There are also system dashboard available on TW Grafana:
TWPro backend dashboard
!!!info Filtering data On Grafana graphs, clicking on a name in the legend panel will filter the graph by that value only; this is useful to check a single workload, as shown in the screenshot below. !!!
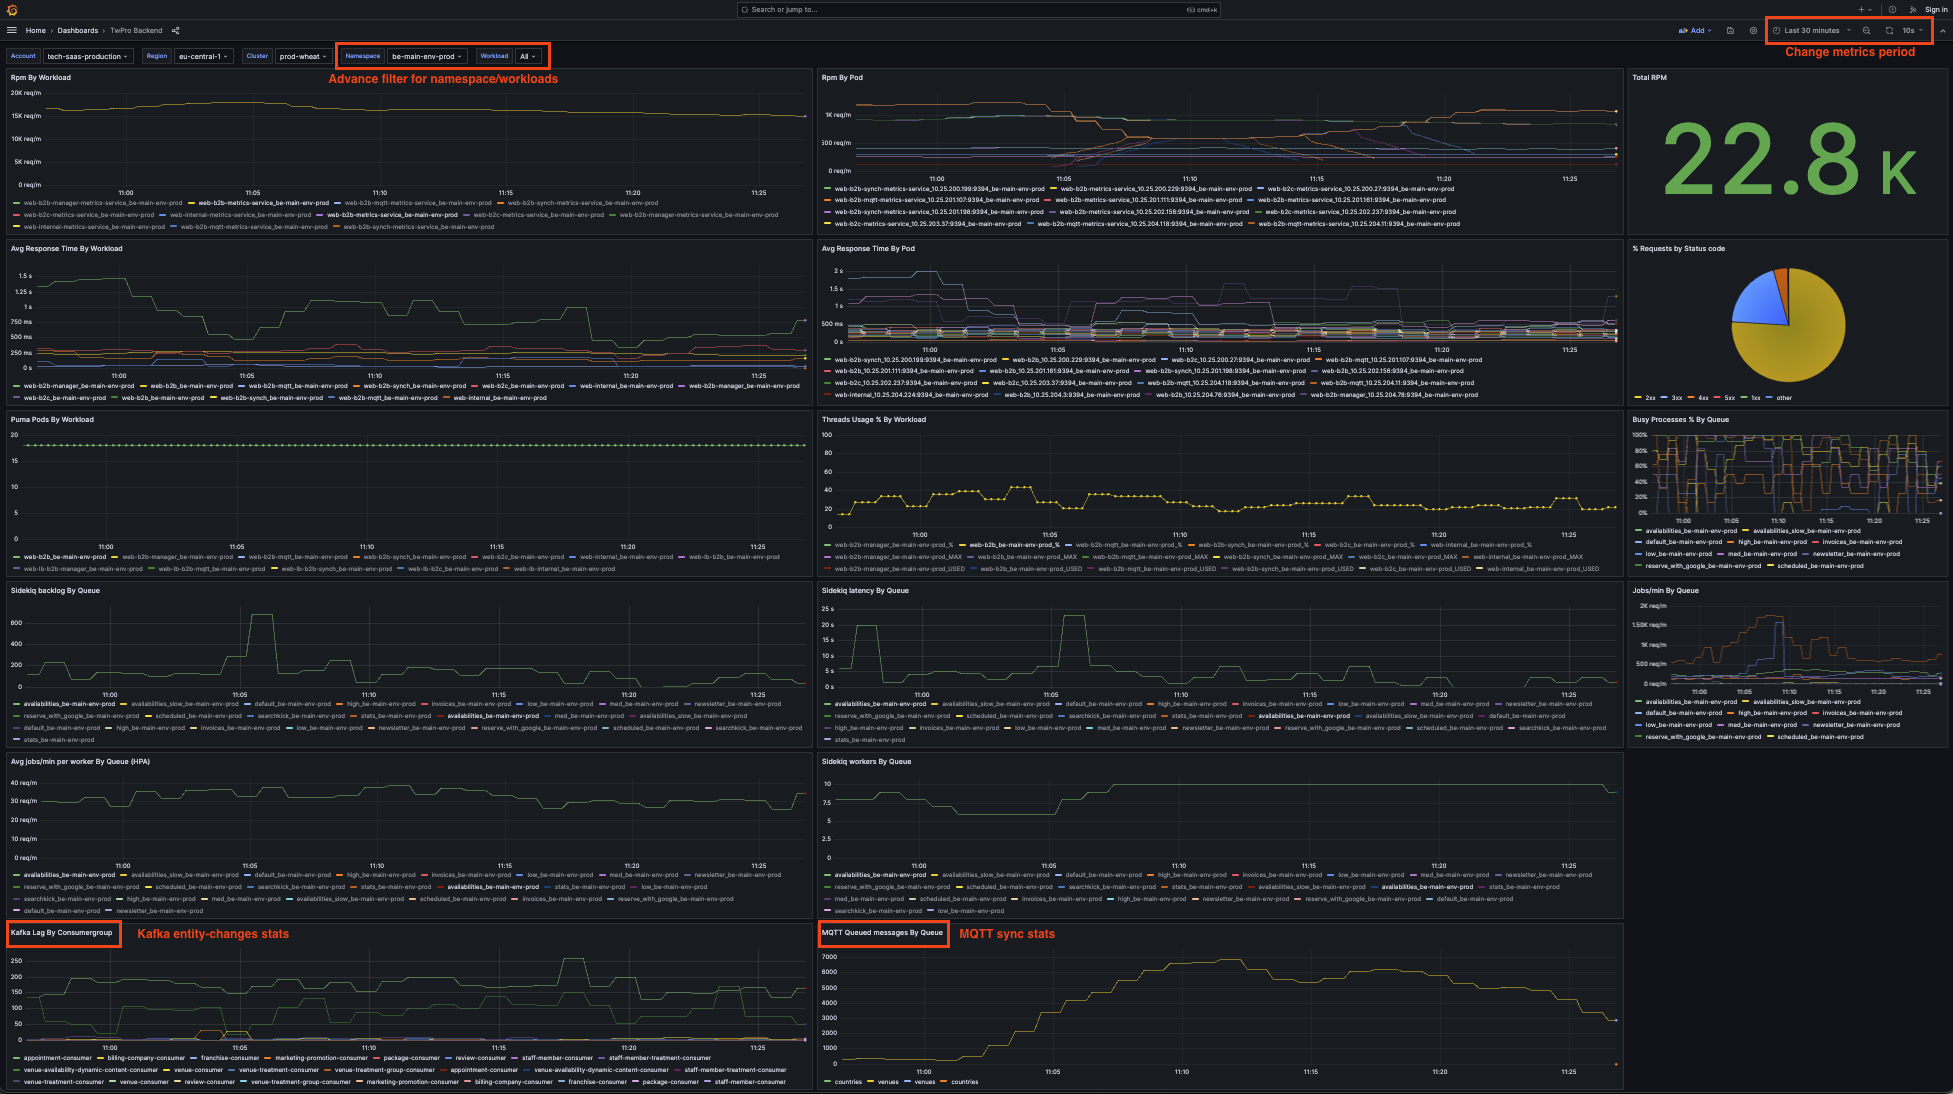
Lots of information are aggregated in this dashboard, and many of them are the same available in Infra Dashboard.
Additional graphs that can be found are:
-
Web server:
- Rpm By Workload
- Avg Response Time By Workload
- Puma Pods By Workload (see autoscaling)
- Threads Usage % By Workload: percentage of usage of Puma threads (exported with Prometheus exporter)
-
Background workers:
- Busy Processes % By Queue: percentage of usage of Sidekiq threads (exported with Prometheus exporter)
- Sidekiq Backlog By Queue
- Sidekiq Latency By Queue
- Avg jobs/min per worker By Queue (HPA) (used for autoscaling)
- Sidekiq Workers By Queue (see autoscaling)
-
Other:
- Kafka Lag By Consumergroup: Kafka cluster lag metric by consumer group (entity-changes)
- MQTT Queued messages By Queue
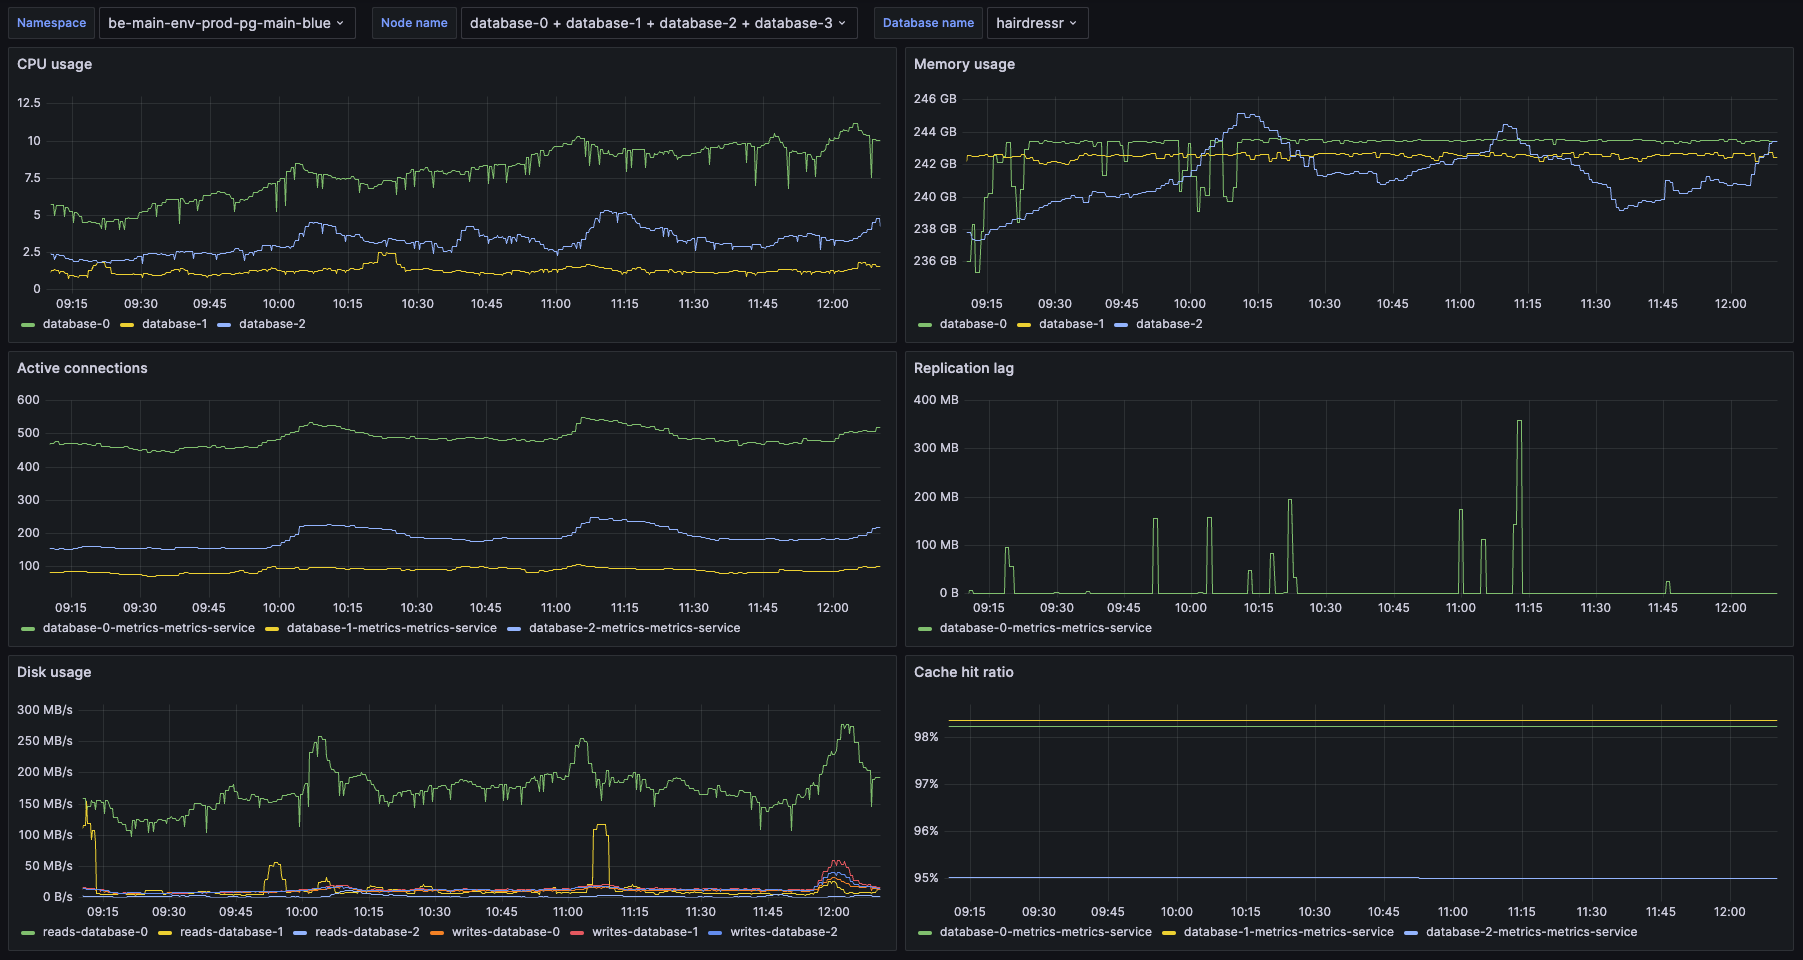
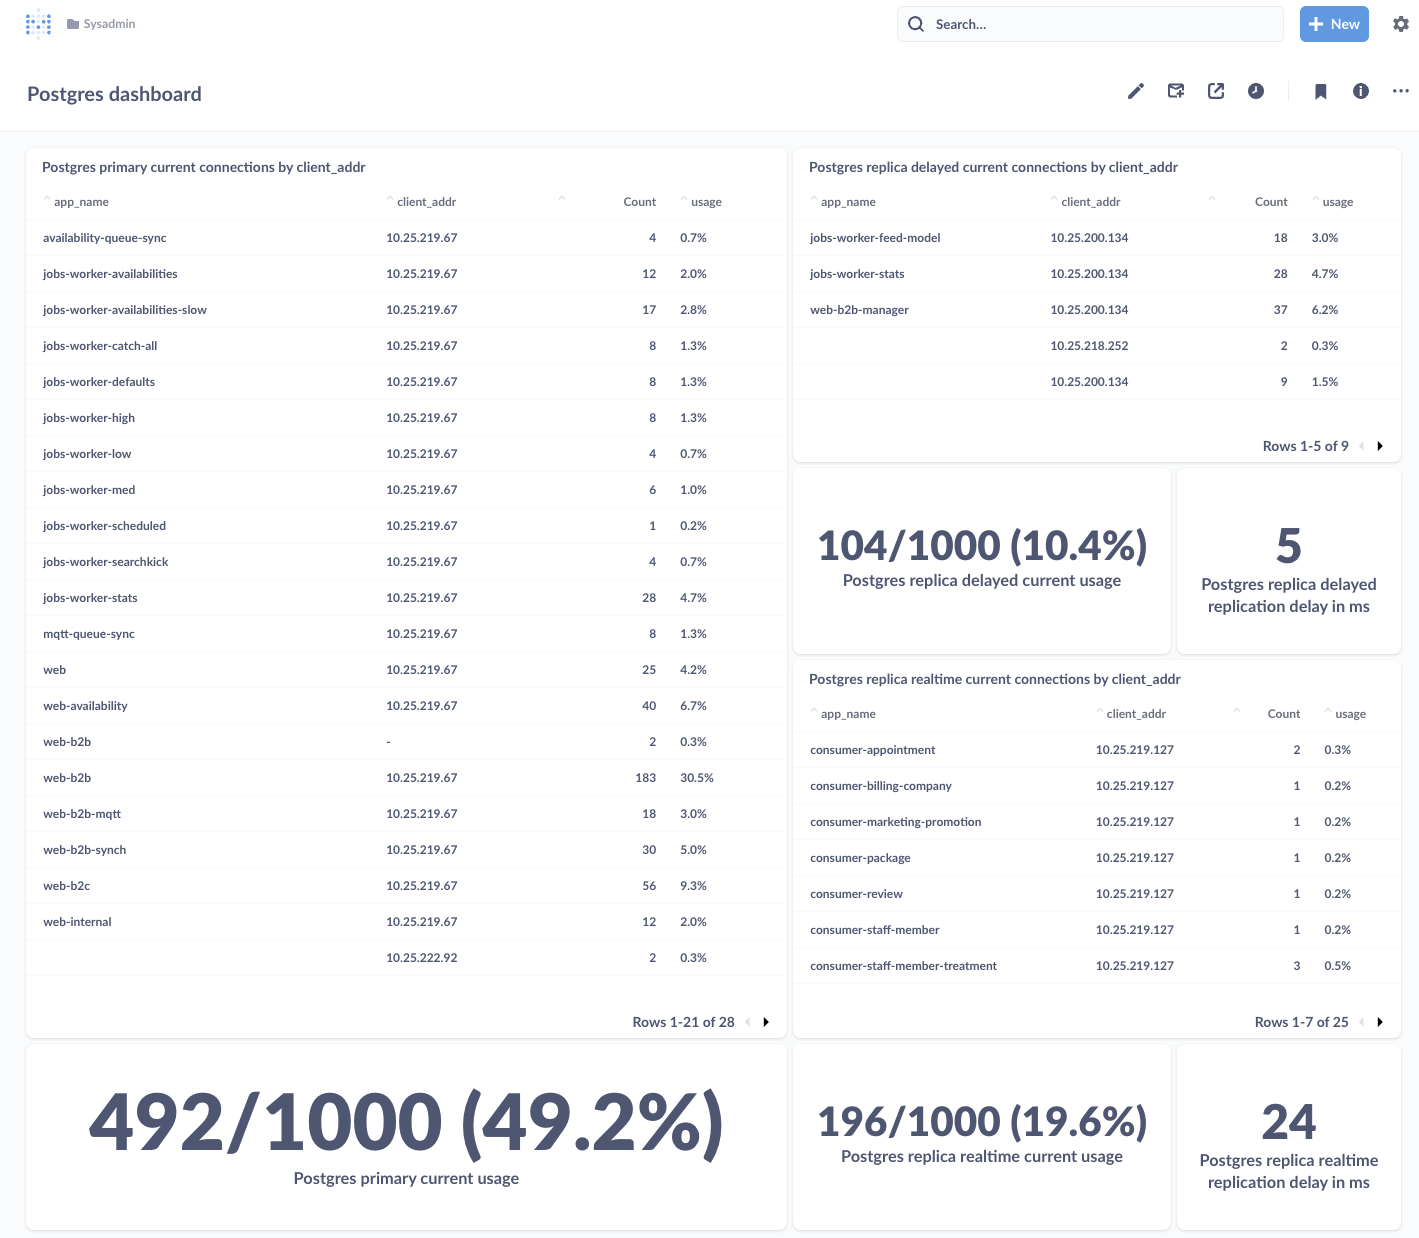
PostgreSQL dashboard
A simple dashboard with PostgreSQL metrics
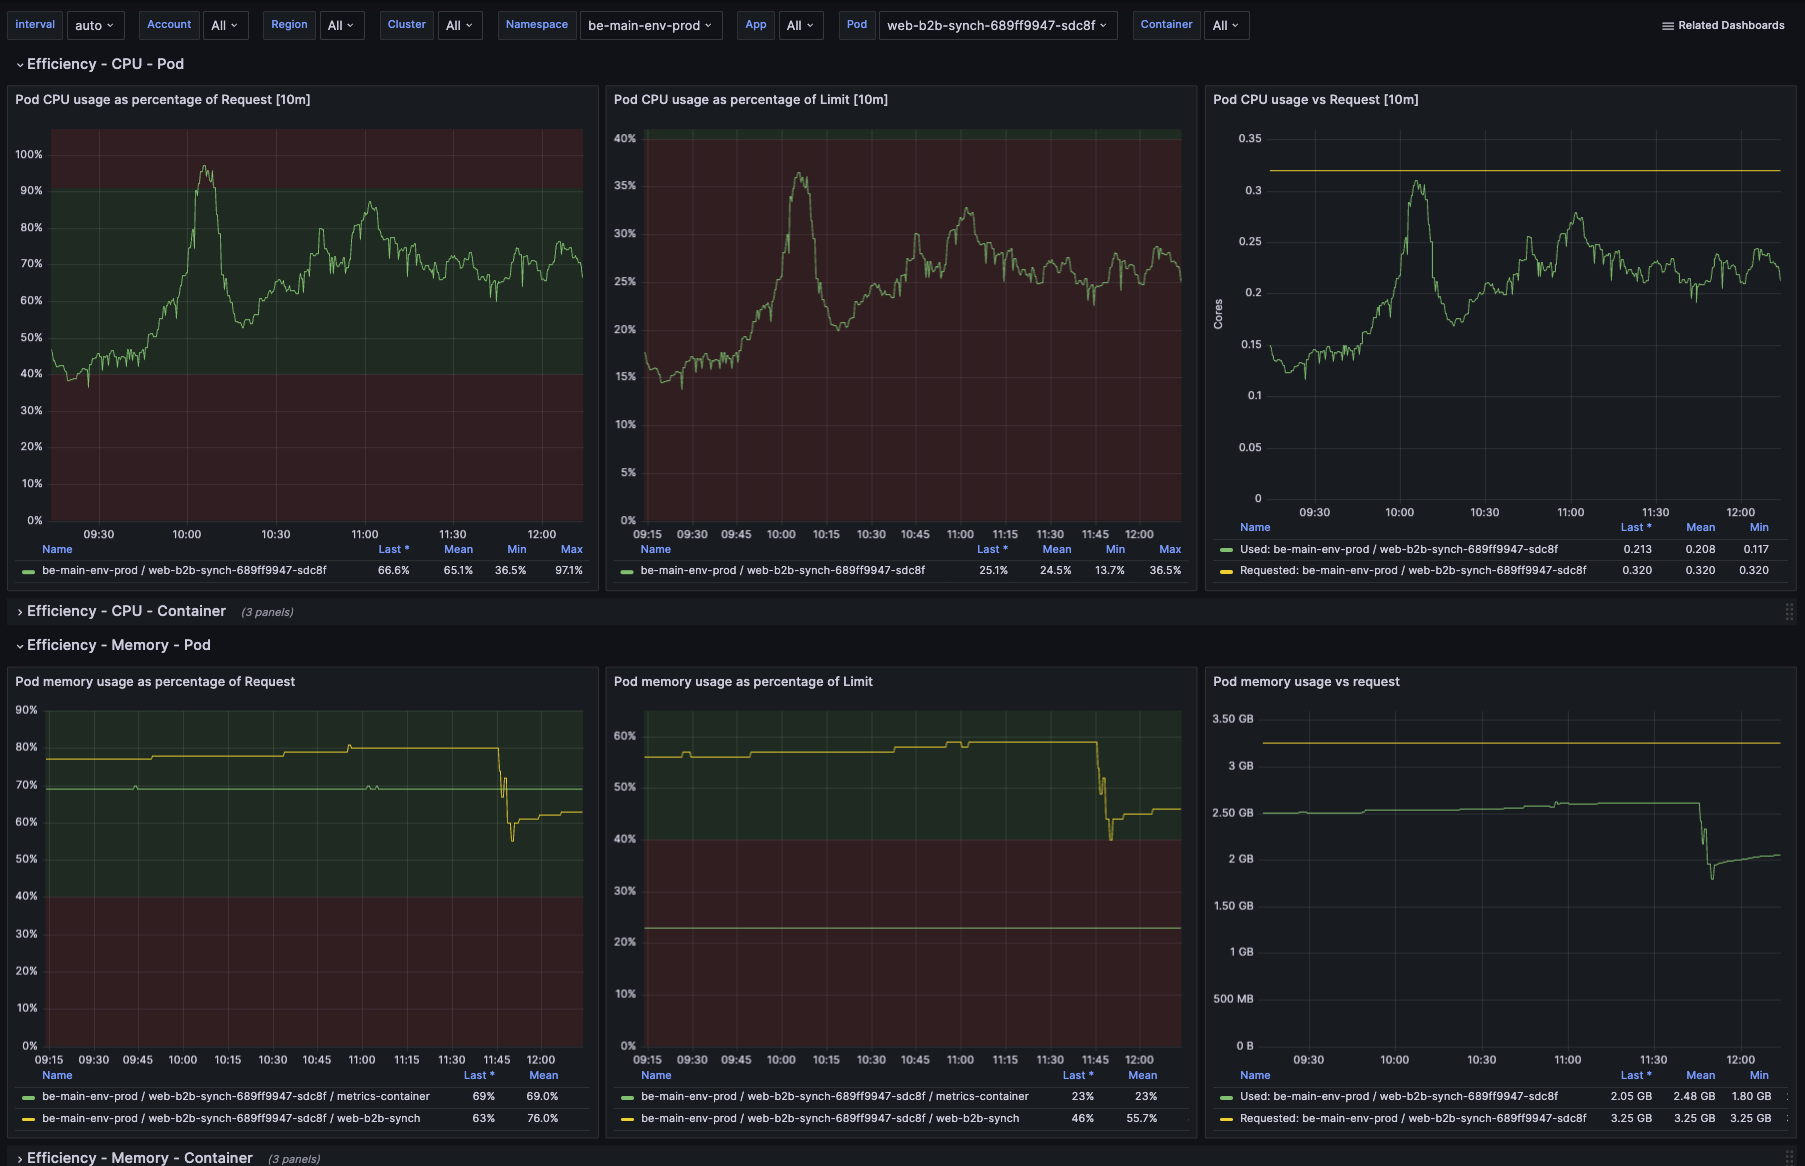
K8S pod efficiency
Useful to monitor pod resources efficiency (high CPU, unexpected memory usage, ...)
Slack channels
There are many Slack channels that can be useful when monitoring the application:
- #tech-twpro-alerts-backend: Datadog / backend error alerts for
uala-backend. Quick actions are also available.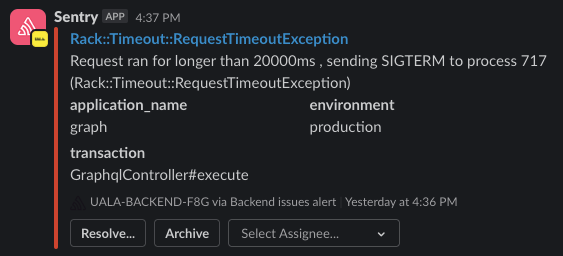
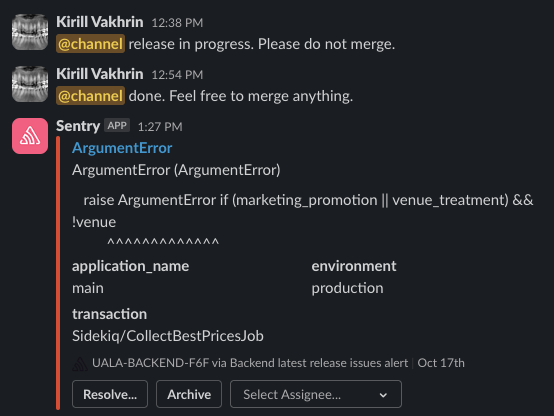
- #be-saas-releases: where release authors will notify about incoming release and the latest release's Datadog error alerts are notified.
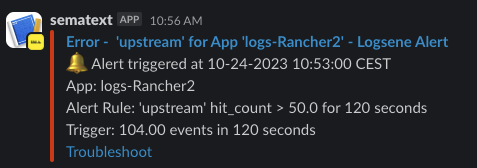
- #tech-uala-sematext: Sematext alerts for the system. The "Troubleshoot" link will bring you to the alert logs.
- #tech-alerts-prod-uala: Prometheus alerts for production cluster
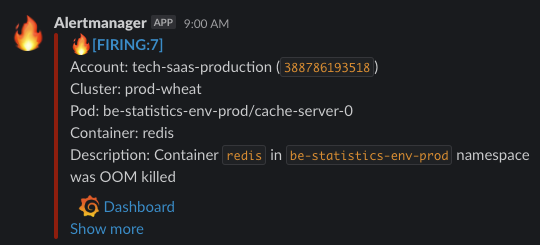
- #tech-alerts-dev-uala: Prometheus alerts for dev cluster
PostgreSQL metabase dashboard and questions
There are many questions and a dashboard useful to debug and check PostgreSQL status:
!ref PostgreSQL dashboard !ref PostgreSQL questions collection
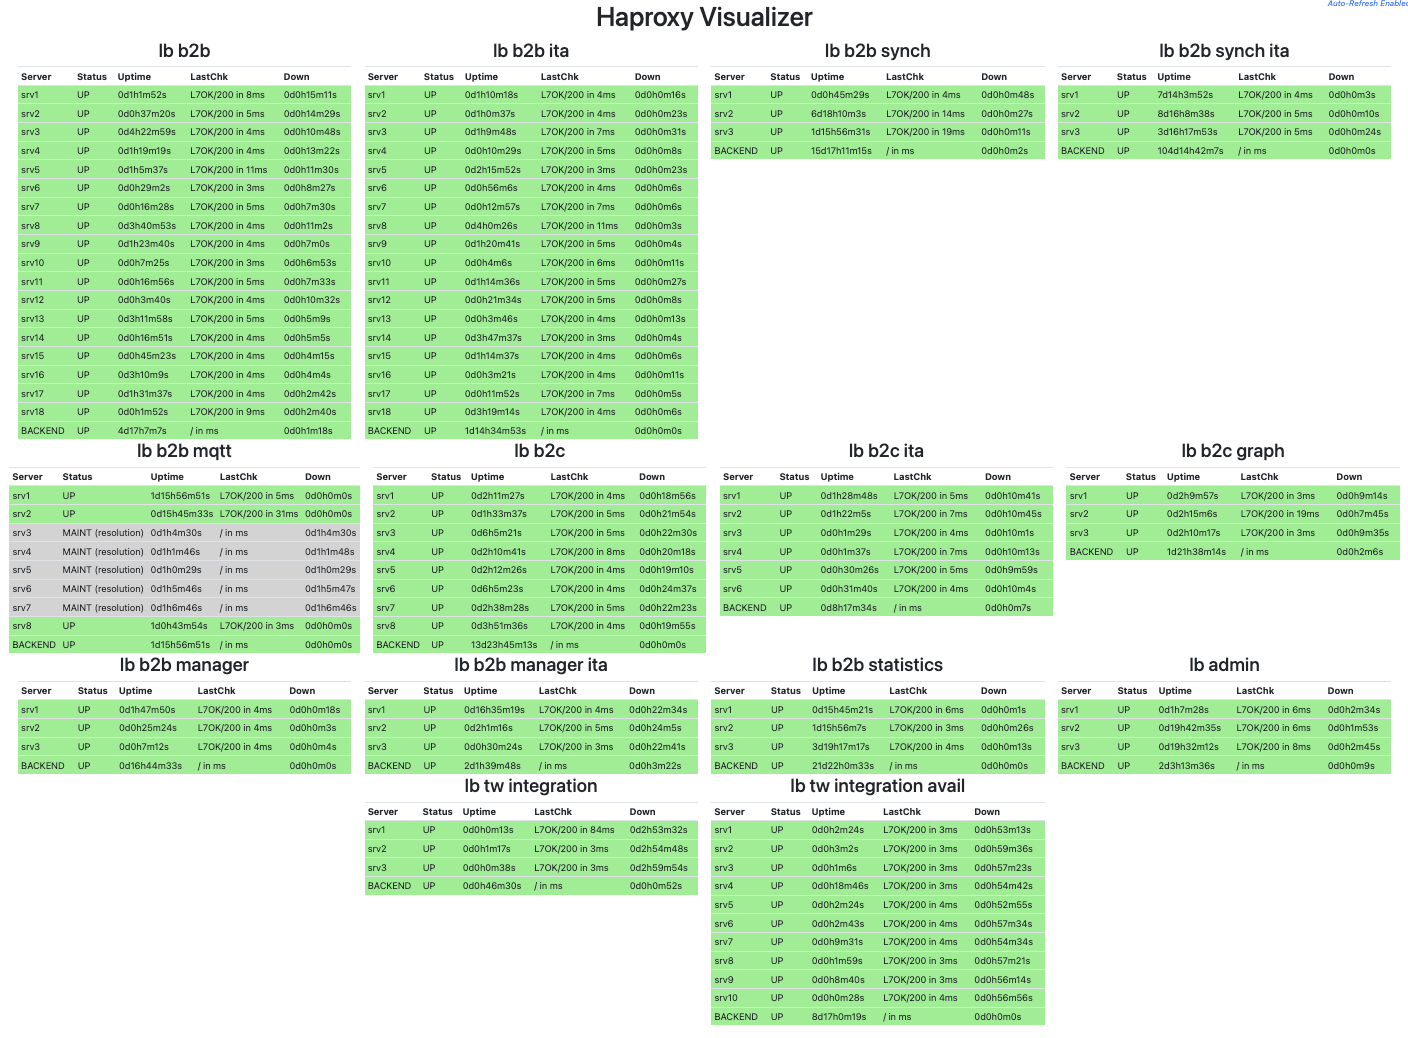
Load balancer overview page
!!!warning Red cells Red cells in this dashboard is what to look at. An intermittent switch to red signals a bad behaviour, it's usually a symptom that web servers' load is too high or their response time is too slow. During deploy, servers are "replaced", so it's normal that some of them turns red and then back to green in the short time. !!!
This page aggregates data exposed by haproxy with all balancer of the backend systems. Green cells means that workload is properly connected, gray cells means that workload is not present (see autoscaling) and red cells
Infrastructure
If you're expecting some log to be present but the journey is somehow truncated (missing Rails request logs, missing Sidekiq job completion logs), it is possible that something happened at infrastructure level (container stopped, restarted, etc.). In that case the best thing to do is get in touch with platform team.